Introduction
Previously I showed how straightforward it is to build a user interface with TornadoFX and how expedient it is to re-use modules from a well-designed MVC application. In this post I capitalize on these facts and build a Humidification Column App.
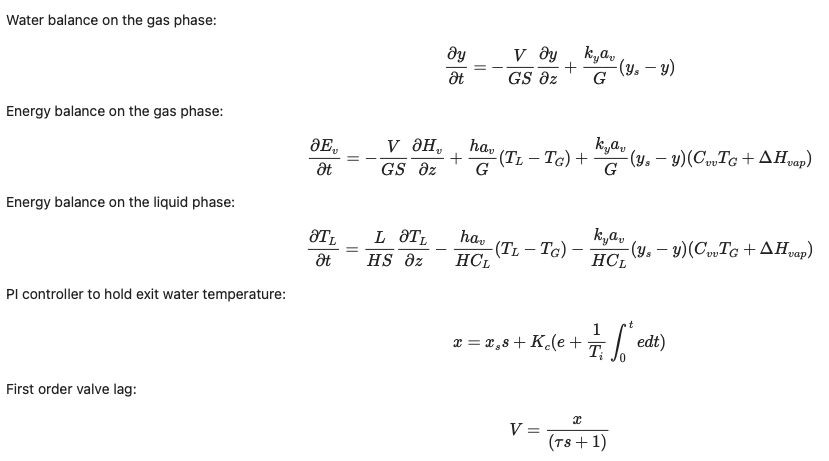
The Humidification column is described in detail in ref. 1. It consists of a packed column where warm water from the top is contacted with dry, warm air from the bottom. The water is cooled on its way down the column from evaporative cooling while the moisture content in the air increases. A PI-controller senses the water exit temperature and adjusts the incoming air rate in order to hold the water temperature at setpoint. The column is modelled by three partial differential equations plus the PI controller and valve equation.

These equations are easily implemented in Kotlin. Here I just show the code for calculating the derivatives. Please note that I have not followed strict Kotlin conventions in naming my variables. This is because I have translated the original FORTRAN code almost verbatim.
    override fun updateDerivativeVector(derivativeVector: DoubleArray, time: Double): DoubleArray {

        val dydt = derivativeVector.copyOf()

        val e = tl[0] - TLSET
        x = XSS + KC * (e + EI / TI)
        if (x < 0) {
            x = 0.0
        }
        if (x > 1) {
            x = 1.0
        }
        V = CVDP * x
        val P1 = V / (G * S)

        val ep = tg.copyOf()
        val ys = tg.copyOf()
        for (I in 0 until N) {
            tg[I] = (ev[I] - y[I] * DHVAP) / (CVA + y[I] * CVV)
            ep[I] = CPA * tg[I] + y[I] * (CPV * tg[I] + DHVAP)
            val exponent = 7.96681 - 3002.4 / (378.4 + 1.8 * tl[I] + 32.0)
            val P = pow(10.0, exponent)
            ys[I] = P / (760.0 - P)
            if (ys[I] < 0) {
                ys[I] = 0.0
            }
        }

        y[0] = 0.01
        tl[N-1] = 43.33
        tg[0] = 43.33
        ep[0] = CPA * tg[0] + y[0] * (CPV * tg[0] + DHVAP)

        val yz = derivativesAtGridpoints(xL = 0.0, xU = ZL, n = N, u = y).b
        val epz = derivativesAtGridpoints(xL = 0.0, xU = ZL, n = N, u = ep).b
        val tlz = derivativesAtGridpoints(xL = 0.0, xU = ZL, n = N, u = tl).b

        var index = 0
        for (I in 0 until N) {
            dydt[index] = -P1 * yz[I] + P2 * (ys[I] - y[I])
            index += 1
        }
        for (I in 0 until N) {
            val P7 = CVV * tg[I] + DHVAP
            dydt[index] = -P1 * epz[I] + P3 * (tl[I] - tg[I]) + P2 * (ys[I] - y[I]) * P7
            index += 1
        }
        for (I in 0 until N) {
            val P7 = CVV * tg[I] + DHVAP
            dydt[index] = P4 * tlz[I] - P5 * (tl[I] - tg[I]) - P6 * (ys[I] - y[I]) * P7
            index += 1
        }
        dydt[index++] = e
        dydt[index] = (x - valveLag) / tau

        dydt[0] = 0.0
        dydt[N] = 0.0
        dydt[3 * N - 1] = 0.0

        return dydt
    }
The User Interface
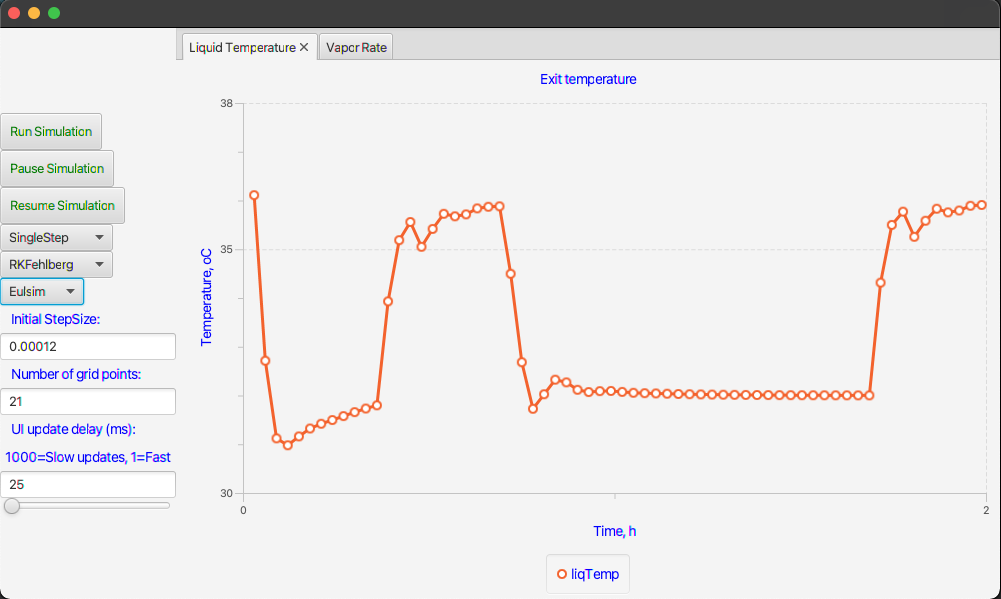
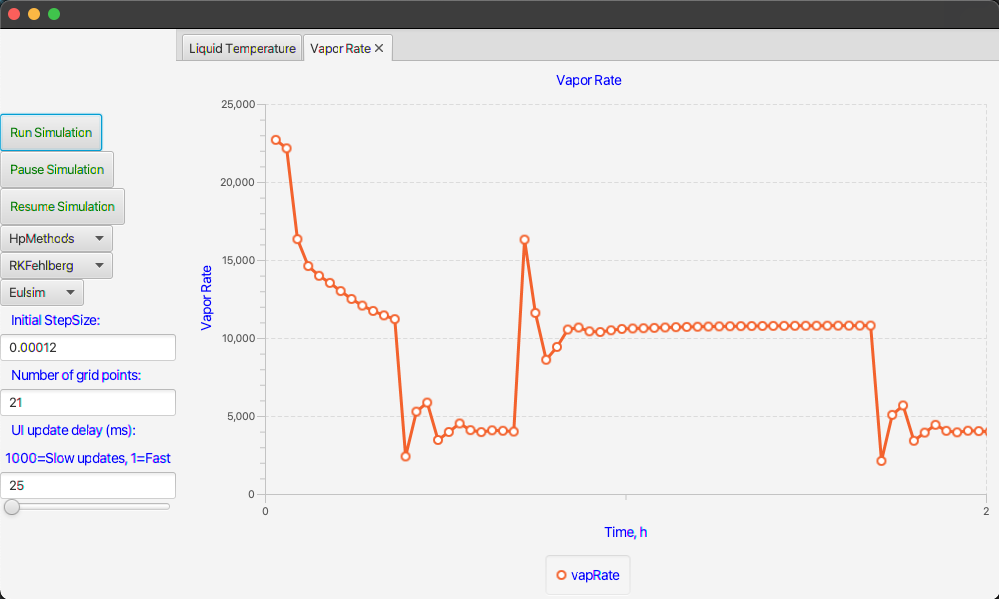
The user interface will consist of a few controls and a couple of plots to show the controlled temperature and the air rate as computed by the PI-controller. It should be possible to make one run after the other while changing the chosen integration method and the number of grid points. Here are screenshots of the final interface.


This interface was almost trivial to construct especially since I copied most of it directly from other models. Here is the TornadoFX code for the interface.
import controller.ViewController
import javafx.geometry.Pos
import javafx.scene.chart.NumberAxis
import tornadofx.*

var viewController = find(ViewController::class)

class MainView: View() {
    override val root = borderpane {
        left = vbox {
            alignment = Pos.CENTER_LEFT
            button("Run Simulation") {
                action {
                    viewController.runSimulation()
                }
            }
            button("Pause Simulation") {
                action {
                    viewController.pauseSimulation()
                }
            }
            button("Resume Simulation") {
                action {
                    viewController.resumeSimulation()
                }
            }
            combobox(viewController.selectedIntMethod, viewController.intMethods)
            combobox(viewController.selectedDiscretizer, viewController.dicretizers)
            combobox(viewController.selectedHpMethod, viewController.hpMethods)
            label("  Initial StepSize:")
            textfield(viewController.initStepSize)
            label("  Number of grid points:")
            textfield(viewController.nGridPoints)
            label("  UI update delay (ms):")
            label("1000=Slow updates, 1=Fast")
            textfield(viewController.simulator.sliderValue)
            slider(min=1, max=1000, value = viewController.simulator.sliderValue.value) {
                bind(viewController.simulator.sliderValue)
            }
        }
        center = tabpane {
            tab("Liquid Temperature") {
                linechart("Exit temperature", NumberAxis(), NumberAxis()) {
                    xAxis.isAutoRanging = false
                    val xa = xAxis as NumberAxis
                    xa.lowerBound = 0.0
                    xa.upperBound = 2.0
                    xa.label = "Time, h"
                    yAxis.isAutoRanging = false
                    val ya = yAxis as NumberAxis
                    ya.lowerBound = 30.0
                    ya.upperBound = 38.0
                    ya.label = "Temperature, oC"
                    series("liqTemp") {
                        data = viewController.liqTempData
                    }
                }
            }
            tab("Vapor Rate") {
                linechart("Vapor Rate", NumberAxis(), NumberAxis()) {
                    xAxis.isAutoRanging = false
                    val xa = xAxis as NumberAxis
                    xa.lowerBound = 0.0
                    xa.upperBound = 2.0
                    xa.label = "Time, h"
                    yAxis.isAutoRanging = false
                    val ya = yAxis as NumberAxis
                    ya.lowerBound = 0.0
                    ya.upperBound = 25000.0
                    ya.tickUnit = 5000.0
                    ya.label = "Vapor Rate"
                    series("vapRate") {
                        data = viewController.vapFlowData
                    }
                }
            }
        }
    }
}
The view depends heavily on the (View-)controller for its behavior. The view-controller code is not complicated either and it makes good use of JavaFX’s collection classes. Recall that these are observable objects meaning that they automatically update as changes in the interface are detected.
import Notification.IObserver
import javafx.beans.property.SimpleDoubleProperty
import javafx.beans.property.SimpleIntegerProperty
import javafx.beans.property.SimpleStringProperty
import javafx.collections.FXCollections
import javafx.scene.chart.XYChart
import model.HumidificationColumn
import model.Simulator
import tornadofx.*


class ViewController: Controller(), IObserver {

    var model = HumidificationColumn(21)
    var endTime = 2.0
    var simulator = Simulator(model)

    var liqTempData = FXCollections.observableArrayList<XYChart.Data<Number, Number>>()
    var vapFlowData = FXCollections.observableArrayList<XYChart.Data<Number, Number>>()


    val dicretizers = FXCollections.observableArrayList("Euler", "RungeKutta", "RKFehlberg")
    val intMethods = FXCollections.observableArrayList("SingleStep", "HpMethods")
    val selectedDiscretizer = SimpleStringProperty("Euler")
    val selectedIntMethod = SimpleStringProperty("SingleStep")
    val hpMethods = FXCollections.observableArrayList("Eulex", "Eulsim")
    val selectedHpMethod = SimpleStringProperty("Eulex")
    val initStepSize = SimpleDoubleProperty(0.001)
    val nGridPoints = SimpleIntegerProperty(model.N)


    init {
        simulator.addIObserver(this)
    }

    fun runSimulation() {
        model = HumidificationColumn(nGridPoints.value)
        simulator.ode = model
        simulator.discretizer = selectedDiscretizer.value
        simulator.intMethod = selectedIntMethod.value
        simulator.hpMethod = selectedHpMethod.value
        simulator.initialStepSize = initStepSize.value
        simulator.runSimulation()
    }

    fun pauseSimulation() {
        simulator.pauseSimulation()
    }

    fun resumeSimulation() {
        simulator.resumeSimulation()
    }


    override fun update(theObserved: Any?, changeCode: Any?) {
        val code = changeCode as String
        when (code) {
            "reset" -> {
                if (liqTempData.size > 0) {
                    liqTempData.remove(0, liqTempData.size)
                    vapFlowData.remove(0, vapFlowData.size)
                }
            }
            "update" -> {
                val time = model.time
                liqTempData.add(XYChart.Data(time, model.tl[0]))
                vapFlowData.add(XYChart.Data(time, model.V))
                if (time > 0.333) {
                    model.TLSET = 36.0
                }
                if (time > 0.67) {
                    model.TLSET = 32.0
                }
                if (time > 1.67) {
                    model.TLSET = 36.0
                }
            }
            else -> {}
        }
    }
}
Stiff Problems
In all my previous posts I have used dynamic models that are non-stiff, meaning that the separation of time constants (inverse of eigenvalues) is not large. If we define the largest time constant as the time-scale of the problem then the smallest time constant is the inverse of the numerically largest eigenvalue of the Jacobian matrix. The ratio of the largest time constant to the smallest is called the stiffness ratio.
Why do we care about the stiffness ratio? The reason is that the maximum allowable step size for an explicit integrator like Euler and Runge-Kutta is limited by the smallest time constant of the problem. Thus, the integrator has to evaluate the derivatives roughly as many times as the magnitude of the stiffness ratio. For stiffness ratios < 10^4 we usually don’t notice any performance degradation in using an explicit integrator but as the stiffness ratio grows we start noticing a problem.
Let me illustrate with the Humidification column. Stiffness increases with the number of grid points, N, chosen for the spatial derivative approximations. With the default value of N = 21, the explicit integrator RKFehlberg requires a step size of h = 0.00012 h (= 0.4 seconds) for stability. The time to complete 2 h of process time is roughly 2.2 seconds on my computer. That’s plenty fast.
However, when I double the number of grid points to N = 41, I have to lower the fixed step size to h = 0.00006 to retain numerical stability. The time for 2 h integration triples to 6.6 seconds even though the number of derivative evaluations only doubled. The reason is the nonlinearities in the derivative evaluations. The execution speed is no longer fast but tolerable.
The situation becomes problematic when we double the number of grid points one more time to N = 81. Predictably, the stable step size is h = 0.00003 h (= 0.1 second) but the execution speed is now 23.5 seconds! That’s impracticably slow for evaluating multiple scenarios on a model.
Extrapolation Methods
The general idea of an extrapolation method is to have an integrator that tries to take long time steps, H, by extrapolating the results of several sub-steps, p, within the long step. The long step and the number of sub-steps are adjusted by a step controller to give a desired accuracy of integration. These methods are sometimes referred to as Hp-methods. Here I will not go into details of extrapolation methods but merely refer to a couple of relevant references (2, 3).
The Hp methods come in two flavors, an explicit integrator called Eulex and a semi-implicit version called Eulsim. Eulex has similar stability properties to Euler, Runge-Kutta and RKFehlberg and is not expected to do any better than those. In fact, because of the extra sub-steps involved in an Hp method, we would expect Eulex to do slightly worse than a fixed-step Euler using its largest, stable step size. However, Eulex has the advantage over a fixed-step Euler that the step controller will automatically find a stable step size for a given accuracy.
In contrast to the explicit methods, a semi-implicit method like Eulsim, has a much wider stability region for the step size and should be expected to do better for stiff problems.
The following table summarizes the results of a few runs with the model and its interactive interface. It is pretty clear that for stiff problems the choice of integrator becomes important.
| # Grid points | RKFehlberg, seconds | Eulex, seconds | Eulsim, seconds |
| 21 | 2.2 | 2.7 | 1.1 |
| 41 | 6.6 | 8.4 | 1.2 |
| 81 | 23.5 | 33.2 | 3.8 |
The boldface entries in the table are visualized in a short video that also demonstrates the use of the interface.
Summary
I have covered a few different topics in this post. First, I showed once more how easy it is to construct a user interface with TornadoFX and Kotlin. Second, I demonstrated the power of MVC when it comes to re-use of view- and controller modules for entirely different models. Finally, the concepts of stiff problems and implicit integrators were discussed.
References
- Silebi, C.A. and Schiesser, W.E. Dynamic Modeling of Transport Process Systems, Academic Press, Inc., San Diego, CA, 1992
- Deuflhard, P. “Order and Stepsize Control in Extrapolation Methods”, Numer. Math., 41, 1983, pp 399-422.
- Deuflhard, P., “Recent Progress in Extrapolation Methods”, SIAM Rev. vol 27, 1985, pp. 505-535.